Following are class 4 Math's | Math's MCQS for etea test Preparation 2022
Class 4 Math's MCQS KPK | Class 4 Math's exercise 10 MCQS for etea test Preparation
Class 4 Math's Unit 7 Data Handling MCQS with answers KPK TEXTBOOK
For NTS, ETEA test Preparation following are the grade 4 all subjects MCQS.
On this page we covered the following subject mcqs of class 4.
MOVE TO NEXT UNIT MCQS :
Unit # 7 Data Handling
Important Concept on Data Handling:
1. Bar Graph: A bar chart or bar graph is a chart or graph that presents categorical data with rectangular bars with heights or lengths proportional to the values that they represent. The bars can be plotted vertically or horizontally. A vertical bar chart is sometimes called a column chart.
MCQS OF DATA HANDLING CLASS 4 MATHS KPK
Q. Select the correct answer from the following.
a) It is important that in a bar graph, the _________________ of each bar is same.
i) length ii) colour iii) width iv) value
b) A bar graph can be of _________ types.
i) two ii) three iii) four iv) five
c) _____________ is also called a circle graph.
i) pie chart ii) line graph iii) vertical bar graph iv) horizontal bar graph
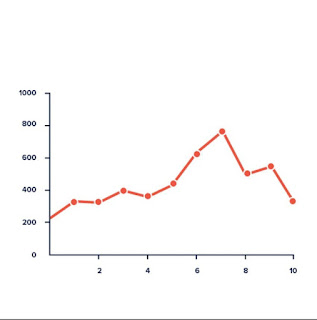
d) A _____________ is drawn by joining the dots representing the quantity of a given value in the question.
i) pie chart ii) line graph iii) vertical bar graph iv) horizontal bar graph
Answers: a) iii b) i c) i d) ii
MOVE TO NEXT UNIT MCQS :


0 Comments